Debugging / Debug Bar
Note: You are currently reading the documentation for Bolt 3.7. Looking for the documentation for Bolt 5.2 instead?
If you're logged in, and 'debug: true' is set in config.yml, you'll see the
'Debug nut' in the lower right corner of all pages of both the frontend and the
backend of the Bolt website. Click it to open the Symfony profiler bar.
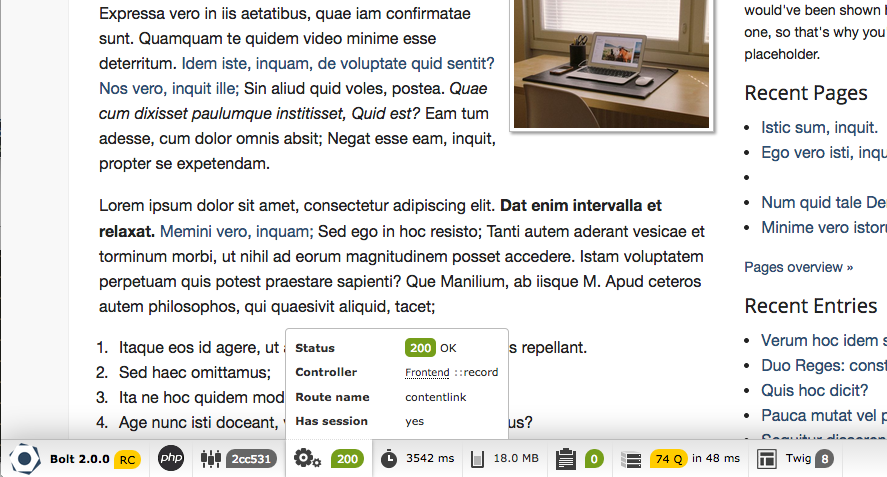
This profiler bar contains a lot of useful information to see what's going on behind the scenes. Click the different tabs to see information about the current request, used templates, matched routes, used queries, server variables and a lot more.
Edit this page on GitHub
Couldn't find what you were looking for? We are happy to help you in the forum, on Slack or on Github.
Couldn't find what you were looking for? We are happy to help you in the forum, on Slack or on Github.