Debugging / Debug Bar
Note: You are currently reading the documentation for Bolt 5.0. Looking for the documentation for Bolt 5.2 instead?
If your environment is set to dev, you'll see the Symfony profiler bar at the bottom of all pages of both the frontend and the backend of the Bolt website.
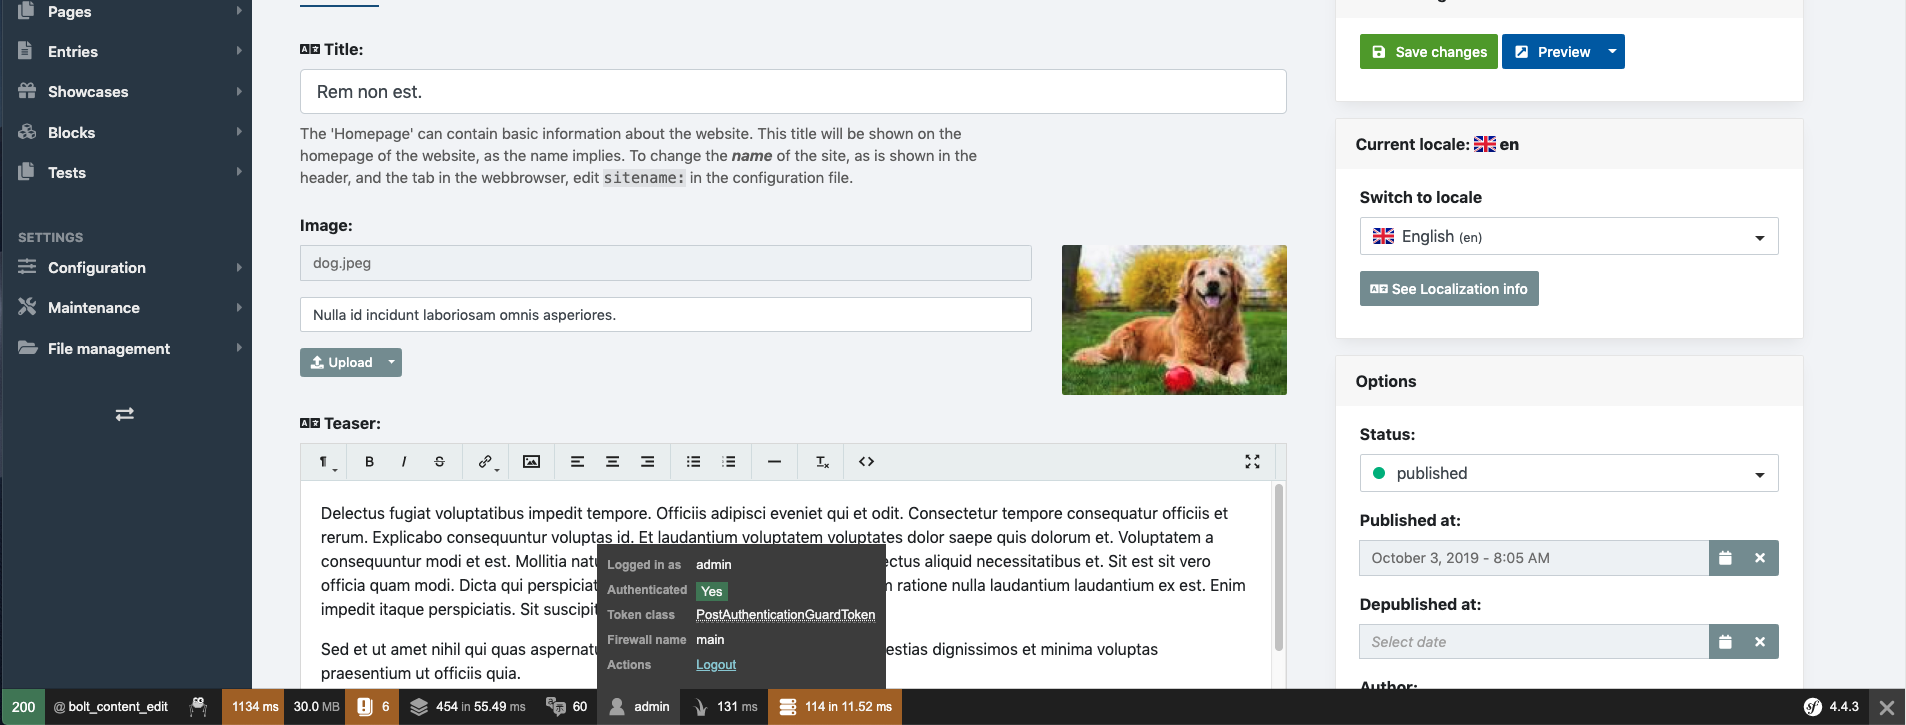
This profiler bar contains a lot of useful information to see what's going on behind the scenes. Click the different tabs to see information about the current request, used templates, matched routes, used queries, server variables and a lot more.
Note: The information available in the profiler bar will depend on the current environment setting . When set to dev, the profiler bar will also show debug information.
Couldn't find what you were looking for? We are happy to help you in the forum, on Slack or on Github.